
Digital technology is now part of our everyday lives, but its use has an environmental impact that is often overlooked. The manufacture of devices, data storage and online activities consume natural resources and energy. By extending the lifespan of our devices and adopting more sustainable digital practices, we can help reduce our environmental footprint.

In 2025, data centres around the world consumed 448 TWh of electricity, which would rank them 11th in the world if they were a country. This digital footprint generated 189 million tonnes of CO₂e. It would take 3.2 billion trees (equivalent to all the trees in the United Kingdom) to offset these emissions over a period of more than ten years. They also consumed 4,500 billion litres of water – enough to fill 1.8 million Olympic-sized swimming pools or meet the needs of 600 million people in sub-Saharan Africa for a year – whilst their energy requirements took up 6,900 km² of land (nearly 4.5 times the area of Greater London). By 2030, this consumption could double to 945 TWh – enough energy to power every household in sub-Saharan Africa for 5.5 years.
For further information: UNU-INWEH-Report-The_Env_Cost_of_AI-2026.pdf
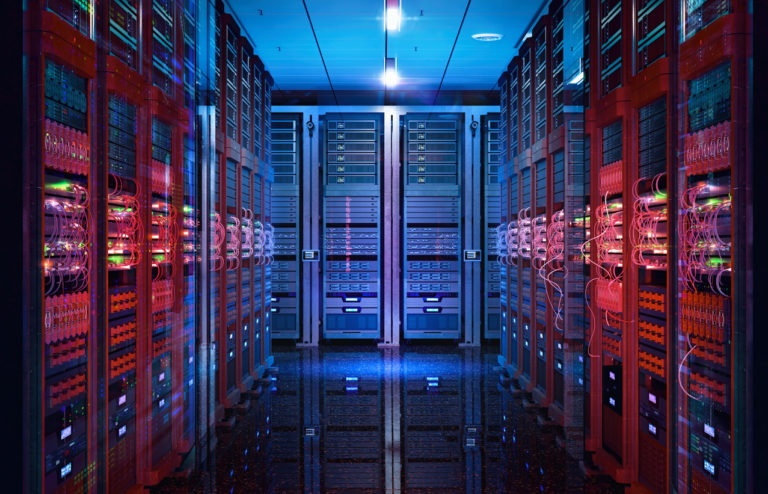
In 2021, Switzerland’s 93 data centres covered nearly 154,000 m², equivalent to 22 football pitches. In 2026, they cover nearly 428,000 m², equivalent to around 60 football pitches – nearly three times as much as five years ago.
They now account for 3.6 per cent of Switzerland’s electricity consumption on their own. According to the 2026 report by Energieschweiz, electricity consumption by commercial data centres could double or even triple by 2030.
Sources: Marché des centres de données en Suisse 2026 et Centres de données en Suisse: consommation et potentiel d’efficacité
Watching one hour of HD streaming video has a much higher carbon footprint (31.7 g CO₂e) than sending 100 emails (4.81 g CO₂e), or even a two-hour Zoom call with 50 people (2.91 g CO₂e).
Downloading content and watching it offline whenever possible therefore helps to significantly reduce one’s digital footprint.
(Source : 2050Today)

Keeping devices for longer and adopting a more moderate approach to digital use can significantly reduce the digital sector’s environmental footprint. Here are a few simple steps you can take.

Protect your devices from knocks, carry out regular updates, and consider repairing, donating or buying refurbished devices before replacing them. For more information, see the City of Geneva’s detailed and handy poster “Extending the life of your devices” (PDF).
Reducing and tidying up your digital data by deleting large or unnecessary files, limiting cloud storage and regularly clearing out emails, apps and duplicates helps to reduce your digital carbon footprint. For more information, see the City of Geneva’s detailed and handy poster “Clearing out your data” (PDF).
Minimise unnecessary emails by consolidating information into a single message, reduce high-definition streaming, and recycle old devices and accessories through dedicated schemes such as NoOPS. Use AI wisely. Some lightweight, task-specific models can consume very little energy and often offer better performance for targeted tasks than large, general-purpose systems.

The perimeter of the 2050Today waste inventory is set to waste production from facilities and internal operations of the institution during the reported year. Only waste treatment in facilities owned or operated by third parties is included in scope 3. The method requires the collection of data on waste quantities by waste type (e.g., Paper, PET, Metal, Biodegradable) and by type of treatment and disposal (Recycled/re-used and not recycled). The waste inventory is part of Scope 3 emissions, Category 5 (Waste generated in operations). Treatment of waste generated in operations is categorized as an upstream scope 3 category because waste management services are purchased by the reporting institution.
This sector includes indicators on the consumption of food and drink items offered by the institution. It includes food and drinks provided at the institution’s cafeteria and/or during in-house events. These indicators are also part of Scope 3 emissions, Category 1 with a “cradle to gate” boundary. Individual food consumption by employees during working hours is also measured.
In this sector, 2050today also use the Average-data method.
The parameter of this sector is set to a list of new office equipment, new mobility equipment (vehicles) and construction materials. Listed indicators are part of Scope 3 GHG emissions, category 1 (Purchased goods and services) with a “cradle to gate” or “upstream” boundary (extraction, production and transportation of goods purchased or acquired by the reporting institution during the year).
To calculate emissions from purchased goods and services, 2050today use the Average-data method, which means estimating emissions for goods and services by collecting data on the mass (e.g., kilograms or pounds), or other relevant units of goods or services purchased and multiplying by the relevant secondary (e.g., industry average) emission factors (e.g., average emissions per unit of good or service).
The Mobility sector is separated into two categories based on the ownership of the vehicles. Emissions from transportation in vehicles owned or leased by the institution are accounted either in Scope 1 (for fuel use) or Scope 2 (for electricity use), while emissions from transportation in vehicles not controlled by the institution (e.g., employees business travel & employee commuting) are part of Scope 3 GHG emissions The institution should be particularly careful if it owns electric vehicles as to avoid double counting of GHG emissions (electricity consumption of electric vehicles could be already included in building electricity consumption).
Data on employees commuting trips is collected through an online flash questionnaire that is sent directly to institutions’ employees. The data in this section is part of Scope 3 GHG emissions, Category 7 (Employee Commuting). This anonymous data is processed directly by 2050Today and will be reported in the calculation of the institutions’ global carbon footprint.
A summary of the vehicle fleet is demanded, and the method requires the collection of data on distances travelled (km) or on fuel usage (kWh of electricity or liters of petrol, diesel, natural gas or biofuel) per vehicle type.
Employee business travels and employee commuting trips data are collected for reporting. The data in this section is part of Scope 3 GHG emissions, Category 6 (Business Travel). Data on terrestrial mobility, similarly to institution owned vehicles data, is collected for distances travelled (km) or for fuel usage (kWh of electricity or liters of petrol, diesel, natural gas or biofuel) per vehicle type. For aerial mobility, the method requires the institution to share information on distances travelled (cumulated km) and/or associated GHG emissions (tCO2-eq.). The share of compensated flights can also be inserted into the form.
For flights, 2050Today uses the Mobitool version 3.0 factors to estimate GHG emissions. The calculation is based on the Atmosfair method which includes the ICAO references and method. In addition to the pure CO2 emissions there are also non-CO2 emissions for flights, which are also recorded, calculated and reported with their climate impact in the Atmosfair method. It uses state of the art of climate science according to IPCC and peer reviewed literature.
The number of nights employees stayed at a hotel in the context of a business trip are included in the Mobility perimeter. This portion of emissions belong to Scope 3.
The perimeter of 2050Today inventory is set to the purchase of grid electricity (in kWh) directly by the institution or through the entity managing the facility. If electricity is produced (through solar photovoltaic panels for instance) and consumed on-site, it is also considered in the inventory. All emissions from grid electricity purchased & consumed by the institution belong to Scope 2. Among the on-site produced & consumed electricity, emissions from combined heat & power installation, oil and natural gas belong to Scope 1.
According to the GHG Protocol, if an institution can be provided with product-specific data in the form of guarantees of origin, certificates, contracts, or other contractual instruments, it will report two scope 2 totals for the overall GHG inventory: one market-based, and one location-based. To be as accurate as possible the physical reality of GHG emissions, 2050Today reports location-based emissions.
The location-based method is calculated using Horocarbon UNIGE assessment tool to measure the grid average emission factor for Geneva.
We have further categorized the electricity purchased from the grid based on its source. For the electricity purchased from SIG, it includes different types of products such as Electricité Vitale Bleu or Electricité Vitale Soleil. There may also be a portion of electricity sourced from coal, oil, solar, or wind power. In this inventory, institutions can fill in the corresponding table with data based on the generation source of the electricity they have purchased.
2050Today’s carbon footprint methodology considers only the location-based method, or in other words grid electricity emissions. Product-specific data can be provided through the data entry form for information purposes and referenced accordingly but not considered in GHG calculations.
For this category, the amount of the energy source consumed to heat and/or cool the institution’s building area are included (e.g., liters of heating oil, m3 of natural gas, kWh of electricity). If the institution is benefiting from GeniLac, it can indicate the total quantity of water that was used by the system during the year.
If one institution purchases heating or cooling services from district heating or SIG product, this portion of emissions would belong to Scope 2. If one institution generates heating or cooling on site from energy sources like natural gas or oil, this portion of emissions would belong to Scope 1. We also categorized the heating & cooling based on its source, so that institutions can fill in the corresponding table with data based on the generation source.
The cooling perimeter also includes the use of refrigerants for air conditioning. If the refrigerants which belong to GHG are leaked or released into the atmosphere directly, this portion of emission belongs to Scope 1. If we consider the value chain of production of refrigerants, it belongs to Scope 3.
The perimeter of the 2050Today inventory is set to water consumption by the institution. The method requires the collection of data on water in m3 or in liters. Emissions from water consumption belong to Scope 3.