Reducing and decarbonising energy consumption in buildings
are essential to preserving the future of our planet
2050Today recommends integrating energy efficiency principles into building infrastructure in line with planetary boundaries, taking into account the quantity and quality of energy services required.
Effective governance ensures that energy management strategies are well designed, properly implemented, and continuously improved. Governance provides a structured approach to strategic planning in energy management. This involves setting clear objectives, defining roles and responsibilities, and outlining the steps needed to achieve CO₂ emission reduction targets.
Monitoring sustainability over time is essential for tracking progress, identifying areas for improvement, and demonstrating accountability. This involves formalising objectives, documenting methodologies, monitoring implementation and reporting on the results achieved each year. By ensuring continuous monitoring, organisations guarantee transparency, optimise their efforts and maintain their long-term commitment to sustainable development.
While energy-efficient technologies and designs play an important role, individual actions and habits can also have a significant impact. By empowering users and raising their awareness of their role in sustainable development in the buildings they use, we can truly move towards a more environmentally friendly future.
Resources

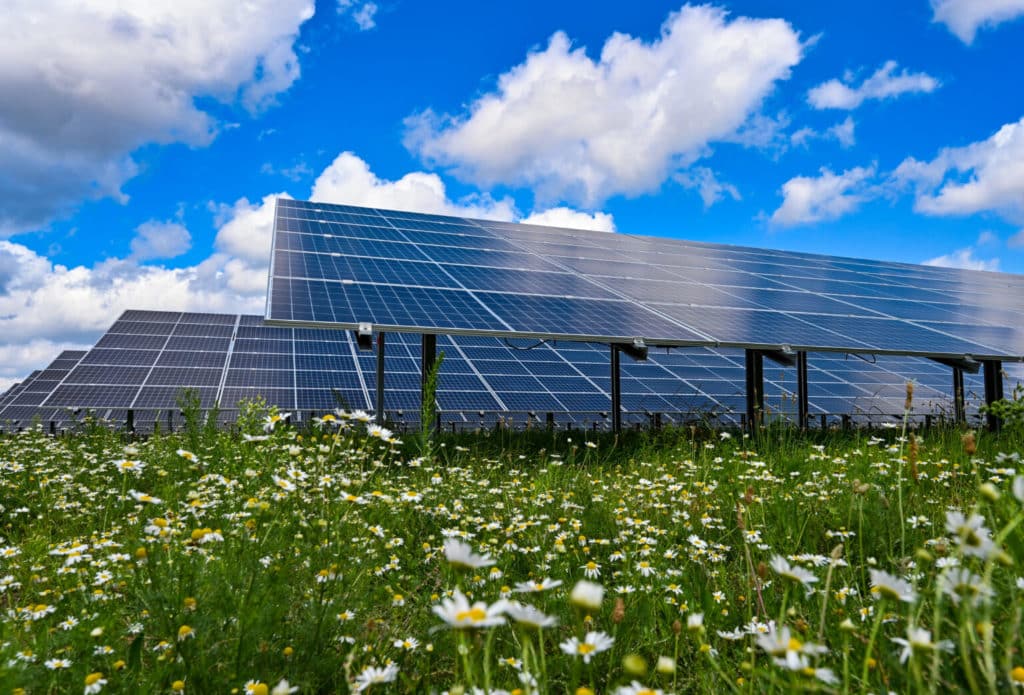
In 2025, the International Labour Organisation (ILO) installed 1,364 photovoltaic panels on the roof of its headquarters, covering 2,663 m². The panels will have a peak energy output of 572 kWp, which will be entirely consumed by the building.
It should not be forgotten that the embodied energy and corresponding indirect carbon emissions of new buildings, as well as their conversion and renovation, are significant. They account for approximately one quarter of the total primary energy required for the production and operation of the building, as well as for user travel. Demolishing a building rather than renovating it can also have a higher carbon footprint when considering the entire life cycle.
This tool suggests actions corresponding to the energy sector objectives of the 2050Today Charter as a reference for defining an action plan.
Based on an initial assessment, each institution is invited to adopt its own actions and develop and implement its action plan in order to achieve its own objectives within 1, 3 and 5 years.
The proposed objectives and actions are non-exhaustive examples and are listed according to the priority of the impact indicator and the suggested objectives:
Level 1: Highest priority
Level 2: Very important
Level 3: Recommended
Get the Excel table listing the objectives and actions for sustainable energy and buildings, ranked by impact priority.
Limiter les déperditions du bâtiment par la cage d’ascenseur (pdf)
Réduire le débit d’eau au niveau des lavabos et des douches (pdf)
Baisser la température de départ en dehors des heures d’utilisation (pdf)
Régler correctement les vannes thermostatiques avant la saison de chauffe (pdf)
Les vannes thermostatiques protègent et limitent la température (pdf)
Les données énergétiques – la clé pour détecter les potentiels d’économies (pdf)
Diminuer le débit de la pompe de circulation (pdf)
Un bon dégivrage fait aussi fondre les coûts (pdf)
Nettoyer régulièrement l’évaporateur des pompes à chaleur (pdf)
Adapter les heures de fonctionnement de la ventilation à son utilisation effective (pdf)
Un bon débit d’air améliore la qualité de l’air intérieur (pdf)
Remplacer les anciennes lampes fluorescentes par des tubes LED modernes (pdf)
Adapter l’intensité de l’éclairage aux besoins réels (pdf)
Régler correctement les capteurs de lumière naturelle et les détecteurs de présence et de mouvement (pdf)
Manuel des mesures concernant l’optimisation de systèmes frigorifiques (pdf)
«Dégivrer» et maintenir au sec les chambres froides et de congélation (pdf)
Accompagnement Négawatt Les écogestes « Bureautique » (pdf)
Accompagnement Négawatt Les écogestes « Chauffage » (pdf)
Accompagnement Négawatt Les écogestes « Éclairage » (pdf)
Accompagnement Négawatt Les écogestes « Mobilité » (pdf)
Accompagnement Négawatt Les écogestes « Pause-café » (pdf)
Accompagnement Négawatt Les écogestes « Rafraîchissement » (pdf)
To help you take action in a structured manner, SIG-éco21 offers a step-by-step guide based on the self-assessment tool.
1. Identify a person responsible for energy issues within the institution.
2. Download the self-assessment tool and the completed template as an example to assist you.
3. Complete the self-assessment tool, set your priorities, and develop your action plan. It is essential to involve your maintenance operators and subcontractors, as they know your facilities and will also be able to contribute ideas.
4. With regard to the operation of the building, you can download the Swiss Energy fact sheets below to help you better define and prepare your future actions.
5. With regard to raising awareness and training your employees, the SIG-éco21 fact sheets below (documents “7. Raising awareness among employees”) will help you communicate best practices. A tip: tackle one topic per week.
2050Today Charter © 2023 by 2050Today is licensed under CC BY-NC-SA 4.0
The perimeter of 2050Today inventory is set to the purchase of grid electricity (in kWh) directly by the institution or through the entity managing the facility. If electricity is produced (through solar photovoltaic panels for instance) and consumed on-site, it is also considered in the inventory. All emissions from grid electricity purchased & consumed by the institution belong to Scope 2. Among the on-site produced & consumed electricity, emissions from combined heat & power installation, oil and natural gas belong to Scope 1.
According to the GHG Protocol, if an institution can be provided with product-specific data in the form of guarantees of origin, certificates, contracts, or other contractual instruments, it will report two scope 2 totals for the overall GHG inventory: one market-based, and one location-based. To be as accurate as possible the physical reality of GHG emissions, 2050Today reports location-based emissions.
The location-based method is calculated using Horocarbon UNIGE assessment tool to measure the grid average emission factor for Geneva.
We have further categorized the electricity purchased from the grid based on its source. For the electricity purchased from SIG, it includes different types of products such as Electricité Vitale Bleu or Electricité Vitale Soleil. There may also be a portion of electricity sourced from coal, oil, solar, or wind power. In this inventory, institutions can fill in the corresponding table with data based on the generation source of the electricity they have purchased.
2050Today’s carbon footprint methodology considers only the location-based method, or in other words grid electricity emissions. Product-specific data can be provided through the data entry form for information purposes and referenced accordingly but not considered in GHG calculations.
For this category, the amount of the energy source consumed to heat and/or cool the institution’s building area are included (e.g., liters of heating oil, m3 of natural gas, kWh of electricity). If the institution is benefiting from GeniLac, it can indicate the total quantity of water that was used by the system during the year.
If one institution purchases heating or cooling services from district heating or SIG product, this portion of emissions would belong to Scope 2. If one institution generates heating or cooling on site from energy sources like natural gas or oil, this portion of emissions would belong to Scope 1. We also categorized the heating & cooling based on its source, so that institutions can fill in the corresponding table with data based on the generation source.
The cooling perimeter also includes the use of refrigerants for air conditioning. If the refrigerants which belong to GHG are leaked or released into the atmosphere directly, this portion of emission belongs to Scope 1. If we consider the value chain of production of refrigerants, it belongs to Scope 3.
The perimeter of the 2050Today inventory is set to water consumption by the institution. The method requires the collection of data on water in m3 or in liters. Emissions from water consumption belong to Scope 3.
The Mobility sector is separated into two categories based on the ownership of the vehicles. Emissions from transportation in vehicles owned or leased by the institution are accounted either in Scope 1 (for fuel use) or Scope 2 (for electricity use), while emissions from transportation in vehicles not controlled by the institution (e.g., employees business travel & employee commuting) are part of Scope 3 GHG emissions The institution should be particularly careful if it owns electric vehicles as to avoid double counting of GHG emissions (electricity consumption of electric vehicles could be already included in building electricity consumption).
Data on employees commuting trips is collected through an online flash questionnaire that is sent directly to institutions’ employees. The data in this section is part of Scope 3 GHG emissions, Category 7 (Employee Commuting). This anonymous data is processed directly by 2050Today and will be reported in the calculation of the institutions’ global carbon footprint.
A summary of the vehicle fleet is demanded, and the method requires the collection of data on distances travelled (km) or on fuel usage (kWh of electricity or liters of petrol, diesel, natural gas or biofuel) per vehicle type.
Employee business travels and employee commuting trips data are collected for reporting. The data in this section is part of Scope 3 GHG emissions, Category 6 (Business Travel). Data on terrestrial mobility, similarly to institution owned vehicles data, is collected for distances travelled (km) or for fuel usage (kWh of electricity or liters of petrol, diesel, natural gas or biofuel) per vehicle type. For aerial mobility, the method requires the institution to share information on distances travelled (cumulated km) and/or associated GHG emissions (tCO2-eq.). The share of compensated flights can also be inserted into the form.
For flights, 2050Today uses the Mobitool version 3.0 factors to estimate GHG emissions. The calculation is based on the Atmosfair method which includes the ICAO references and method. In addition to the pure CO2 emissions there are also non-CO2 emissions for flights, which are also recorded, calculated and reported with their climate impact in the Atmosfair method. It uses state of the art of climate science according to IPCC and peer reviewed literature.
The number of nights employees stayed at a hotel in the context of a business trip are included in the Mobility perimeter. This portion of emissions belong to Scope 3.
This sector includes indicators on the consumption of food and drink items offered by the institution. It includes food and drinks provided at the institution’s cafeteria and/or during in-house events. These indicators are also part of Scope 3 emissions, Category 1 with a “cradle to gate” boundary. Individual food consumption by employees during working hours is also measured.
In this sector, 2050today also use the Average-data method.
The parameter of this sector is set to a list of new office equipment, new mobility equipment (vehicles) and construction materials. Listed indicators are part of Scope 3 GHG emissions, category 1 (Purchased goods and services) with a “cradle to gate” or “upstream” boundary (extraction, production and transportation of goods purchased or acquired by the reporting institution during the year).
To calculate emissions from purchased goods and services, 2050today use the Average-data method, which means estimating emissions for goods and services by collecting data on the mass (e.g., kilograms or pounds), or other relevant units of goods or services purchased and multiplying by the relevant secondary (e.g., industry average) emission factors (e.g., average emissions per unit of good or service).
The perimeter of the 2050Today waste inventory is set to waste production from facilities and internal operations of the institution during the reported year. Only waste treatment in facilities owned or operated by third parties is included in scope 3. The method requires the collection of data on waste quantities by waste type (e.g., Paper, PET, Metal, Biodegradable) and by type of treatment and disposal (Recycled/re-used and not recycled). The waste inventory is part of Scope 3 emissions, Category 5 (Waste generated in operations). Treatment of waste generated in operations is categorized as an upstream scope 3 category because waste management services are purchased by the reporting institution.